Separating the signal from the noise in scRNA-Seq data (new paper!)
We’ve developed a smoothing algorithm that makes the analysis of high-throughput single-cell RNA-Seq a lot easier. The algorithm effectively removes technical noise while largely preserving biological heterogeneity. You can read the paper on bioRxiv and find reference implementations in Python/R/Matlab on github.
In the YanaiLab, we love single-cell RNA-Seq data, and we’re proud of our work in developing new and innovative scRNA-Seq protocols, including CEL-Seq, CEL-Seq2, and most recently, scDual-Seq. We also perform inDrop in the lab, which was developed based on the CEL-Seq protocol, and share the widespread excitement about the ability of high-throughput scRNA-Seq technologies such as inDrop, Drop-Seq or Seq-Well to transform our understanding of complex diseases.
However, anyone who has worked with scRNA-Seq data also knows that analyzing single-cell expression data can be challenging, given how noisy the data is. Even in the absence of differential expression, the observed transcript counts for an individual gene can fluctuate wildly across samples, and sometimes not a single transcript is observed in a portion of cells, even though we have every reason to believe that the gene is expressed in those cells.
By using dimensionality reduction techniques such as PCA and t-SNE, special filtering criteria, and some other clever tricks, we and others have learned to circumvent some of the issues arising from the noisiness of the data. For particular applications, special tools have been developed that fit statistical models to the data, in an effort to extract as much information as possible. But for all of the power of scRNA-Seq, there is something deeply unsatisfying about not being able to properly examine the data without first performing multiple filtering, dimensionality reduction, and clustering steps, each involving the choice of a number of parameters that may require careful tuning for each dataset.
When I joined the lab as a postdoc this summer, I made it my mission to develop a general-purpose method to change that. As a first step, I decided to examine the statistical properties of the noise in high-throughput scRNA-Seq data. To my surprise, I discovered that across protocols, the noise followed simple Poisson statistics, rather than more complex models that assume an excess of zero values (“dropouts”). Based on this observation, and with help from Yun and Itai, I designed the “k-nearest neighbor smoothing” algorithm, which exploits the statistical properties of UMI-filtered scRNA-Seq data to separate the signal from the noise. I would say that it works so well that it has fundamentally changed the way I think about scRNA-Seq data and how it can be analyzed!
Here is an example using data from Maayan Baron’s paper on characterizing cell types found in pancreatic islet tissue using scRNA-Seq:
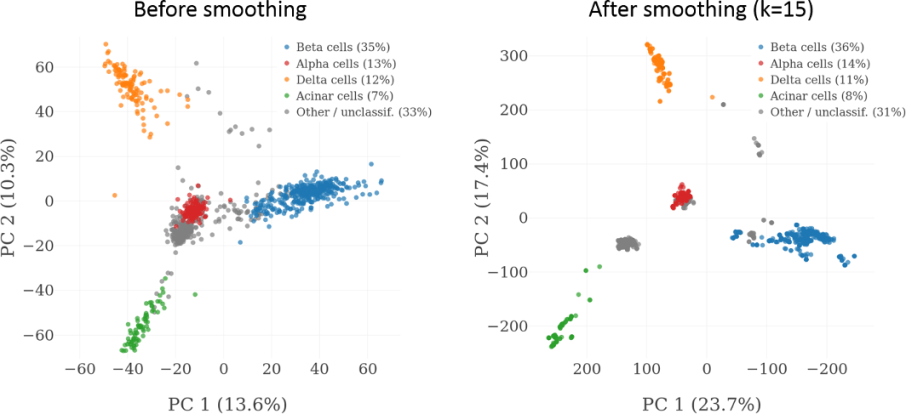
As can be seen from the PCA plot, cell type clusters become much more easily distinguishable after smoothing. K-nearest neighbor smoothing also makes it much easier to explore scRNA-Seq using hierarchically clustered heatmaps, which were once one of the most popular tools for the exploratory analysis of heterogeneous expression datasets, but have lost a lot of their popularity in the age of scRNA-Seq, as they cannot handle noisy data very well. As an example, here is a detail from a heatmap that was generated by clustering the 1,000 most variable genes in a dataset containing 2,109 pancreatic islet cells, before and after smoothing:

The detail only shows expression profiles from ductal (left), endothelial (middle), and stellate cells (right). Without smoothing, the heatmap is riddled with noise, which almost disappears completely after smoothing with k=15. What’s more, it looks like there are two subpopulations of stellate cells with slightly different expression profiles. The smoothing algorithm preserves this distinction – this is very important, because we want to avoid smoothing over biologically meaningful expression differences.
So how does the algorithm do it? For each cell, it identifies the k most similar cells (“neighbors”), and aggregates (sums up) their transcript counts. This yields “smoothed” expression profiles, where the degree of smoothing is determined by the choice of k. The key part of the algorithm is the unique way in which the k most similar cells are determined: Similarity is measured based on normalized and variance-stabilized expression profiles, and the k cells are identified in a step-wise fashion, based on partially smoothed profiles, leading to more accurate sets of neighbors compared to a one-step approach.
Our paper containing more statistical and algorithmic details, as well as additional examples, can be downloaded from bioRxiv. Reference implementations of the algorithm in Python, R, and Matlab can be found on GitHub. (Thanks to Yun Yan and Maayan Baron for contributing the R and Matlab implementations, respectively!) We highly encourage you to try the algorithm on your own scRNA-Seq data, as a simple preprocessing step for whatever type of analysis you’re doing. You might be surprised to find previously hidden signals in your data!
")


